California Coastal Poll Tutorial
2019-03-01
Lesson 1 Introduction
1.1 Overview
Questions
Using data from the California Coastal Poll:
- What are attitudes towards climate change?
- How can I visualize this?
- How can I share results online?
Objectives
- Use RStudio to code in R.
- Read data from an Excel spreadsheet into R (using R package
readxl). - Summarize data (using
dplyr). - Visualize data (using
ggplot2). - Version files with git.
- Share results online with Github.
1.2 Prerequisites
R Skill Level: Beginner – you can be completely new to R, RStudio, git and Github. This will give you a flavor for how they work.
1.2.1 Install software
1.This workshop will require the following software installed on your machine:
- git: version control
- R: statistical programming language
- RStudio: integrated development environment
Please download the appropriate stable release for your operating system.
1.2.2 Create Github login
Create Github account at http://github.com, if you don’t already have one. For username, I recommend all lower-case letters, short as you can. Ideally the username that prefixes your csuci.edu email is available. If you use an email ending in .edu, you can request free private repositories through GitHub Education.
Be sure to keep track of your username and password, referred to as USER and PASSWORD throughout the rest of this tutorial, to be replaced by YOUR username and password.
1.3 Launch RStudio
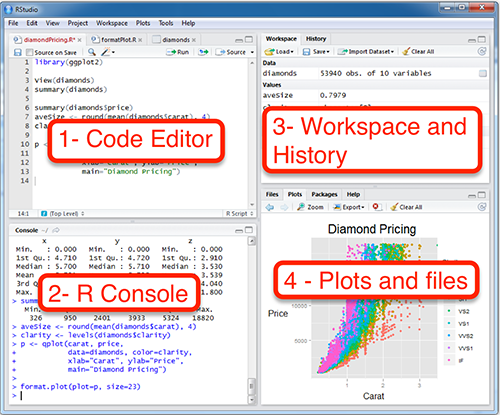
RStudio is as it is an integrated development environment (IDE) for editing text in the code editor, running commands in the R console, viewing defined objects in the workspace and past commands in the history, and viewing plots, files and help. Here’s a layout of the panes in RStudio, each of which can have several tabs for alternate functionality:
For a quick overview of the RStudio interface, check out the menu Help > Cheatsheets > RStudio IDE Cheat Sheet.
We’ll use RStudio shortly, but first let’s create a repository in Github for synchronizing file versioning and publication of results online.