Research
Here are some research highlights. For a full list of publications, please see my CV.
Species Distribution Modeling
Cetaceans in US Atlantic
Habitat-based cetacean density models for the U.S. Atlantic and Gulf of Mexico (2015 Version) (Roberts, Best et al 2016)
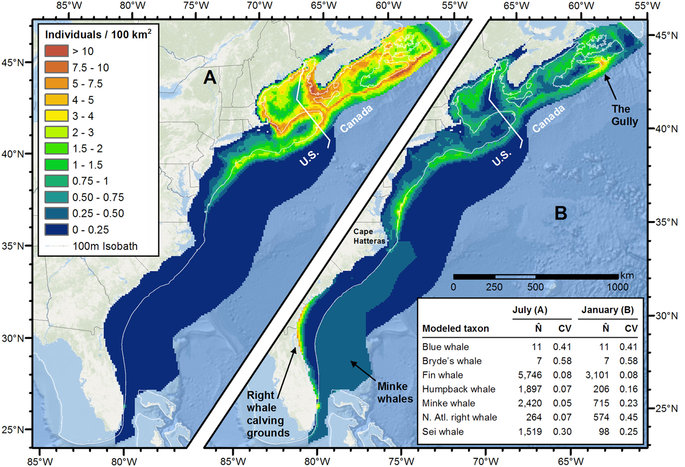
Figure 5 from the paper showing the predicted mean density of baleen whales in July (A) and January (B) for the East Coast region.
Marine Mammals in British Columbia
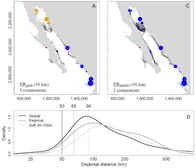
Updated marine mammal distribution and abundance estimates in coastal British Columbia (Best et al 2015)
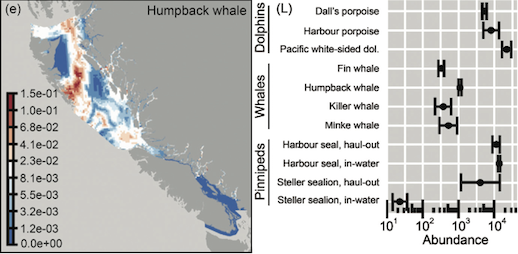
Extracted from Figure 7 in the paper showing the relative distribution (e) and overall abundance estimates for the inner waters of British Columbia.
Spatial Decision Support Frameworks
For these spatial decision support frameworks, I implemented an interactive visualization whereby the map, plot and table are synchronized with each other, and can be interactively explored to highlight sites or routes.
Siting Offshore Wind Energy
Siting offshore wind energy to minimize impacts on birds in space and whales in time
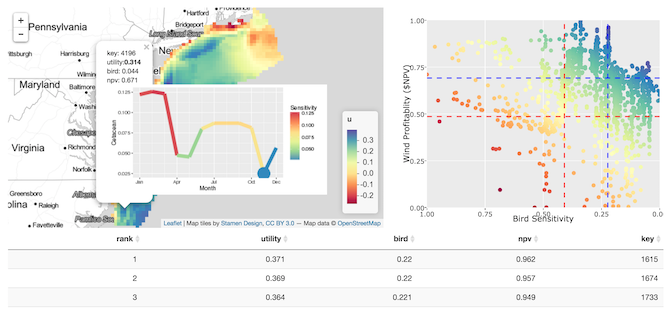
Sites on the map (10 km2 pixels) in the US Mid-Atlantic are colored according to the average utility depicted in the tradeoff plot to: maximize profitability to offshore wind energy development (net present value in US$, on normalized scale) on y-axis, and minimizing bird sensitivity on x-axis (based on 20 bird species distributions summed and weighted by sensitivity to collision and displacement, also on a normalized scale). Click a site on the map to see the cetaceans sensitivity over time, so that episodic events that impart high acoustic energy underwater (seismic air gun surveying and pile driving) can be scheduled at times when endangered whales, such as the North Atlantic Right Whale, are generally absent.
Routing Ships around Whale Hotspots
Routing ships to minimize whale strikes
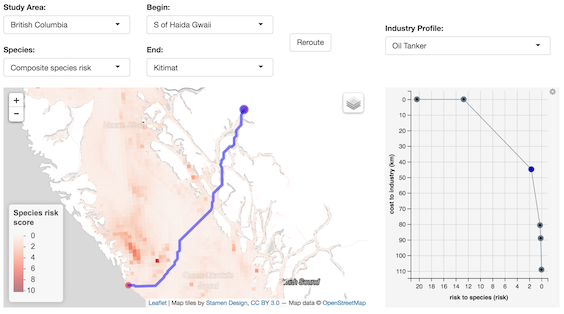
Routes between starting and end points are selectable from the drop-down selections as ports and major entry points to British Columbia, or arbitrary start and end points can be entered. Routes are then visible in the interactive map based on varying levels of avoidance of marine mammal hotspots as derived by summing across marine mammal density surfaces and weighting by conservation concern. This uses a prescriptive least-cost routing approach rather than post-hoc evaluation of proposed routes.
Connectivity
Larval Connectivity in Baja California by Habitat Type
Habitat-specific larval dispersal and marine connectivity: implications for spatial conservation planning (Anadón et al 2013)
Larval Dispersal Animation
Larval dispersal modeling example of grouper spawning in the Gulf of California using Marine Geospatial Ecology Tools
Web Portal Development
Reproducible Science
Please see my Teaching page, particularly for Environmental Informatics.